
More Information
Submitted: June 18, 2022 | Approved: July 08, 2022 | Published: July 11, 2022
How to cite this article: Virani K, Patel P, Banker A, Muchhadia R, Rajpara Y, et al. Establishment of soft tissue norms for sagittal discrepancy for maxilla and mandible in central Gujarat population. J Clin Adv Dent. 2022; 6: 016-020.
DOI: 10.29328/journal.jcad.1001027
Copyright License: © 2022 Virani K, et al. This is an open access article distributed under the Creative Commons Attribution License, which permits unrestricted use, distribution, and reproduction in any medium, provided the original work is properly cited.
Keywords: Mew line; Meridian line; Soft tissue profile; Esthetics

Establishment of soft tissue norms for sagittal discrepancy for maxilla and mandible in central Gujarat population
Khyati Virani1*, Pankti Patel2, Alka Banker3, Rahul Muchhadia4, Yagnesh Rajpara5 and Yesha Modi1
1Post-Graduate Student, Department of Orthodontics, Goenka Research Institute of Dental Science, Gandhinagar, Gujarat, India
2Senior Lecturer, Department of Orthodontics, Goenka Research Institute of Dental Science, Gandhinagar, Gujarat, India
3Former Professor and Head, Department of Orthodontics, Goenka Research Institute of Dental Science, Gandhinagar, Gujarat, India
4Professor and Head, Department of Orthodontics, Goenka Research Institute of Dental Science, Gandhinagar, Gujarat, India
5Professor, Department of Orthodontics, Goenka Research Institute of Dental Science, Gandhinagar, Gujarat, India
*Address for Correspondence: Dr. Khyati Virani, Post-Graduate Student, Department of Orthodontics, Goenka Research Institute of Dental Science, Gandhinagar, Gujarat, India, Email: [email protected]
Objective: To establish the cephalometric norms of ‘Zero meridian line’ and ‘Mew line’ to assess the sagittal discrepancy in the maxilla and mandible of subjects in the Central Gujarat population
Materials and methods: The sample was screened from the records from the hospital. 100 individuals (50 males, 50 females) of the age group between 18-50 years, native of Central Gujarat, with acceptable pleasing profile, no skeletal asymmetry, normal Class I occlusion having ideal anterior bite, less than 2 mm crowding and no history of previous orthodontic treatment were selected for the study. Lateral cephalograph were taken in natural head position. The linear measurements between points of soft tissue pogonion to the Zero Meridian line (vertical line dropped from soft tissue nasion) and distance of Mew line (the biting edge of the upper front teeth to the tip of the nose) was taken on cephalograms.
Result: Mean value for soft tissue pogonion to the Zero meridian line on cephalograms was 0.2 mm for female and 0.8 mm for male and mean value for Mew line on cephalograms was 39 mm for female and 42 mm for male subjects.
Conclusion: Normal value for soft tissue pogonion to the Zero meridian line is 0.8 + 1.8 mm for males and 0.2 + 1.7 mm for females, and normal value for Mew line is 41.2 + 3.2 mm for male and 39.4 + 2.2 mm for female in Central Gujarat population. Values other than normal suggests skeletal sagittal discrepancy of maxilla and/or mandible, which is helpful in diagnosis and treatment planning.
Over the last 50 years, many cephalometric parameters have been proposed to describe anteroposterior jaw relation-ships [1]. In orthodontic diagnosis and treatment planning, assessment of anteroposterior discrepancy is of importance to the orthodontist. Both angular and linear measurements have been incorporated into various cephalometric analyses to help the clinician diagnose anteroposterior (AP) discrepancies and establish the most appropriate treatment plan [2]. Since the introduction of cephalometrics by Broadbent [3], numerous cephalometric measurements have been devised. Of those Downs [4], Steiner [5], Tweed [6,7], Ricketts [8,9] and Jacobson [10,11] probably have gained the widest acceptance. The analyses of Coben [12], Wylie [13], Sassouni [14,15], Enlow [16] and associates Bimler [17], Edward Beatty’s [18], AXD angle, Rocco J. Di Paolo [19], Stephen Williams [20], Sang D Yang [21], are perhaps less widely used, but they are nevertheless well known. Various cephalometric analyses for orthodontic treatment have been designed, but these cephalometric norms were specific to one ethnic group-white subjects of European American ancestry. Cephalometric norms derived from the Caucasian population are routinely used for investigations. As these norms show a great degree of variation when applied to different ethnic groups, it becomes necessary to establish the norms for every ethnic group with a standard method for effective orthodontic treatment.
In cephalometric radiographic analysis, angle ANB is commonly used to describe skeletal discrepancies between the maxilla and the mandible. Some authors have stated that points A and B are dentoalveolar landmarks that are influenced by growth, as well as dentoalveolar remodeling during orthodontic treatment. Thus, changes in the position of points A and B are due to a combination of skeletal and dental changes [22]. The position of nasion is not fixed during growth, and any displacement of nasion will directly affect the ANB angle. Although the ANB angle is still very popular and useful, there is often a difference between the interpretation of this angle and the actual discrepancy between the apical bases [2]. Jacobson [10,11] showed that angle ANB does not provide an adequate assessment of variations in skeletal relationships because of inconsistent variations in craniofacial physiognomy, which includes (1) the anteroposterior spatial relationship of nasion relative to jaws and (2) the rotational effect of the jaws relative to cranial reference planes (high palatal, occlusal, and mandibular plane angles) [10]. Jacobson suggested the Wits appraisal as an alternative to the use of angle ANB. The singular advantage of the “Wits” appraisal is that it overcomes this shortcoming i.e., relating jaw bases to the cranial reference plane, and concomitantly emphasizes an awareness of this relationship in the overall interpretation of a cephalometric analysis [11]. The Wits appraisal relates points A and B to the functional occlusal plane. Therefore, consecutive comparisons of the Wits appraisal throughout orthodontic treatment might be of limited value because they also reflect changes in the occlusal plane instead of pure AP changes of the jaws [2].
We used the cephalometric value of ‘Zero meridian line’ and ‘Mew line’ to assess the sagittal discrepancy of the maxilla and mandible as there are no published cephalometric norms for the Central Gujarat population. These parameters are easy to apply to determine the sagittal relationship of the maxilla and mandible.
Source of data
The sample was screened from the records of the Goenka Research Institute of Dental Science. 100 individuals (50 males, 50 females) in the age group 18 - 50 years who are native of Central Gujarat were selected for this study. For the current study, the probability of type 1 error (α) was fixed at 5% and that of type 2 error (β) was fixed at 20%. The power of the study was set at 80%. The sample size for the study was determined scientifically, and using Cohen’s test, a sample size of a minimum of 100 was established. Institutional ethical approval was taken for the study (GRIDS/Admin/2019-20/012).
Selection criteria for subjects
Inclusion criteria
- The age range of 18 - 50 years
- Permanent dentition
- Mesocephalic faces
- Class I occlusion
- Having less than 2 mm crowding and spacing
- Having overjet between 2 + 1 mm
Exclusion criteria
- Previous or current orthodontic treatment.
- Severe crowding.
- Evidence of previous trauma / surgery.
- Facial asymmetry or deformity.
- Clefts or syndromes
Initially, each subject was thoroughly examined clinically according to inclusion and exclusion criteria. A lateral cephalometric radiograph was taken of all subjects. ‘Zero meridian line’ and ‘Mew line’ soft tissue cephalometric analysis was performed and studied. Individuals who agreed to participate in this study were instructed to read and sign the consent form.
Radiographic unit detail
The Pax-I (PCH2500), Vatech Global, a digital radiographic unit from the dental hospital, was used to take the lateral cephalometric radiographs of the subjects involved in the study.
Cephalometric tracing
Tracing of all cephalograms used in this study were made on a matte acetate sheet of 0.004 inches thick and were traced by 0.5 mm, 2HB lead pencil. To identify the intra examiner error ten tracings were randomly picked, retraced, and statistically analyzed. The error was found to be insignificant. The linear measurements between points of soft tissue pogonion to the Zero Meridian line (vertical line dropped from soft tissue nasion) and distance of Mew line (the biting edge of the upper front teeth to the tip of the nose) were taken (Figure 1).
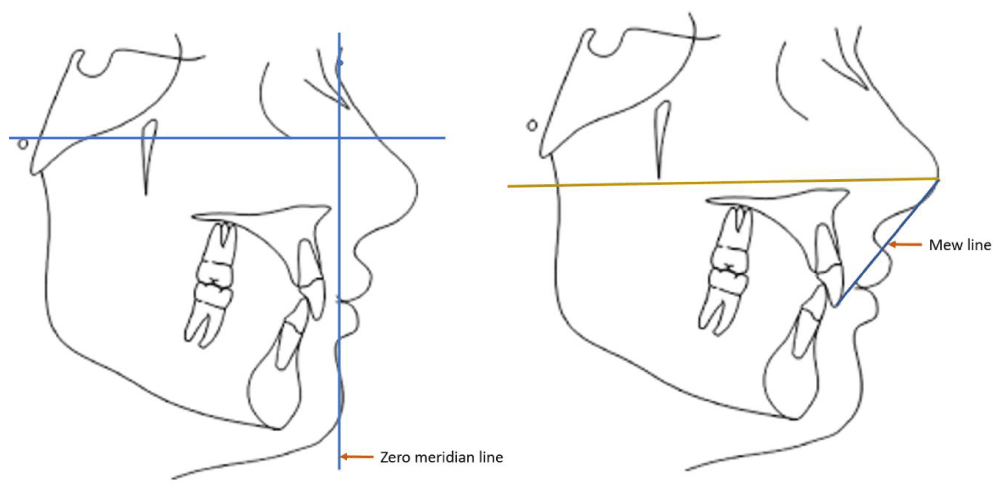
Figure 1: Cephalometric Tracing.
Statistical analysis
The mean and standard deviations for each of the soft tissue cephalometric parameters were calculated and the norms for the Central Gujarat population (men and women) were established. Student’s independent test was used to measure the difference between gender. A p - value of less than 0.05 was considered statistically significant. All p - values were 2 tailed.
The mean value for the Mew line was 41.2 mm (SD 3.2) for males and 39.4 mm (SD 2.2) for females. The mean value for the Zero meridian line was 0.8 (SD 1.8) mm for males and 0.2 (SD 1.7) mm for females. Gender differences (Table 1) illustrate the descriptive and comparative statistics between Indian female and male subjects for soft-tissue morphology. Significant differences were found between male and female subjects in the measurement of the Mew line (p < .05, Table 1).
| Table 1: Comparison of Indian Male and Female Soft-tissue Morphology. | ||||||
| Parameter | Male (n = 50) | Female (n = 50) | Difference | p value | ||
| Mean | SD | Mean | SD | |||
| Mew Line | 41.2000 | 3.23880 | 39.4400 | 2.27820 | 1.76000 | 0.005* |
| Meridiane Line | 0.8000 | 1.75941 | 0.2000 | 1.80125 | 0.6000 | 0.866 |
| Note. *Statistically significant difference (p < .05). | ||||||
Significant differences were not found between male and female subjects in the measurement of the Zero meridian line (p > .05) Figure 2.
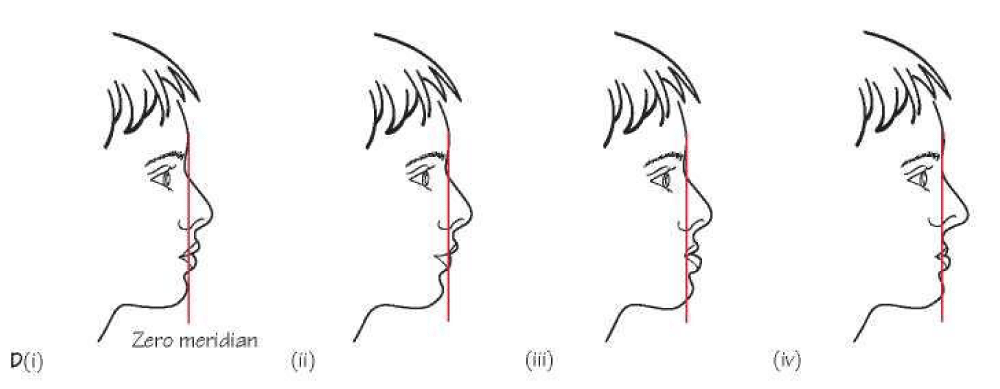
Figure 2: Zero meridian line.
The aim of the present study was to obtain cephalometric norms for Central Gujarat populations to assess the sagittal position of the maxilla and mandible. The ‘Zero meridian line’ and ‘Mew line’ were selected for the study as they are effective, easy to use, and give a good estimate of the sagittal discrepancy of the maxilla and mandible as related to the soft tissue profile. Many clinical methods were developed to estimate the sagittal jaw relationships over forty years ago [2-10]. Cephalometric norms derived from the Caucasian population are routinely used for investigations. As these norms show a great degree of variation when applied to different ethnic groups, it becomes necessary to establish the norms for every ethnic group with a standard method for effective orthodontic treatment.
The zero meridian line was developed by a Mexican plastic surgeon called Mario Gonzalez-Ulloa in 1962 [23]. He traced a line perpendicular to the horizontal line of Frankfort and tangential to the nasion (point of deepest nasal root depression, in the midline), called the zero meridians. He proposed that in a face with ideal proportions, the pogonion (the most prominent point of the chin) should be on that line or immediately posterior to it. It is used to assess the mandibular position. He classified chin retro positioning as grade I, less than 1 cm posterior to the meridian, grade II between 1 and 2 cm, and grade III more than 2 cm. Naini [24], summarized the advantages of this line by its ease of use and came in accordance with the idealized profiles of classical, Renaissance, and neoclassical artistic canons.
The Mew Indicator Line was developed by Dr. John Mew [25]. It is used to assess facial growth by determining the maxillary position. This particular method is used to determine whether the maxilla is in a retruded, protruded, or normal position. It is a linear measurement from the biting edge of the upper front teeth to the tip of the nose. The ideal value behind the Mew indicator line is the individual’s age in addition to the number 23. (Table 2). This measurement differs slightly with different body sizes. However, an increase of 5 mm or more from these standard values indicates abnormal facial growth. The line is measured directly on the face with a ruler (Figure 3) but if desired the line can be measured on a lateral skull x - ray. Clearly, this measurement is no more than an ‘indication’, nevertheless, it is surprisingly accurate.
| Table 2: Ideal Mew line values for each age group for Caucasians. | ||
| Age | Male | Female |
| 5 | 28 mm | 28 mm |
| 6 | 29 mm | 29 mm |
| 7 | 30 mm | 30 mm |
| 8 | 31 mm | 31 mm |
| 9 | 32 mm | 32 mm |
| 10 | 33 mm | 33 mm |
| 11 | 34 mm | 34 mm |
| 12 | 35 mm | 35 mm |
| 13 | 36 mm | 36 mm |
| 14 | 37 mm | 37 mm |
| 15 | 38 mm | 38 mm |
| 16 | 39 mm | |
| 17 | 40 mm | |
| Adult | 40-44 mm | 38-42 mm |
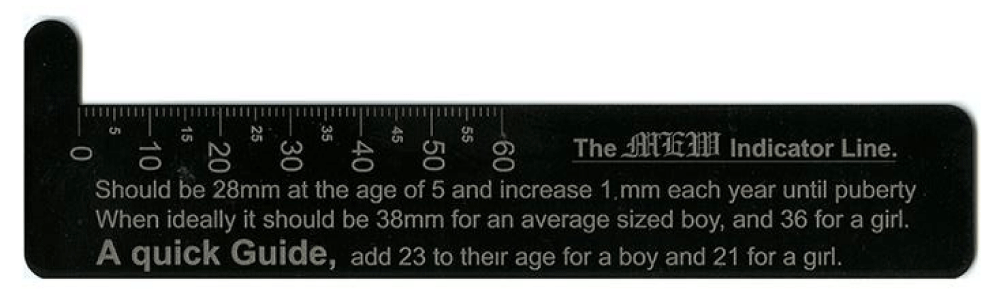
Figure 3: Steel ruler to measure Mew line.
Ricketts [26], was particularly keen to establish the merit of the ‘Golden Proportion’ which he applied to facial appearance. It is certainly an aesthetically pleasing ratio that fits the height and width of many attractive faces however it will also fit many unattractive faces. Moss and his colleagues [27], have shown that faces that fit the golden proportion are at times associated with both skeletal and dental malocclusion and it rarely helps in evaluating good facial growth.
Platou and Zachrisson [28], studied a population of 568 twelve - year - old Scandinavian children. He found that these boys had a mean indicator measurement of 43.9 mm (SD 2.79) while the girls were 41.5 mm (SD 2.62). An unpublished study by J Mew, on 72 randomly selected twelve – year - old British school children (17 boys and 54 girls), showed that the Indicator Lines averaged 43.8 mm for the boys and 41.5 mm for the girls; remarkably similar figures to Platou and Zachrisson’s group. Kerr and Ford’s work [29], would suggest that Scandinavians’ Indicator Lines are probably about 2 millimeters larger than Britons. Kitafusa’s work [30], suggests that Japanese ideals are about 2 millimeters less than British. It can be seen that different ethnic groups have different physiognomy, which reflects on the normal mean value of both the lines.
One auther [31], studied different cephalometric analyses for the A - p relation of jaws and concluded the use of extracranial reference planes was needed for sagittal assessment. Due to the large variability in the human population, a single cephalometric analysis may not provide an accurate diagnosis.
Many studies [32-34], have suggested that though Downs’s angle of convexity, ANB angle, Wits appraisal, and Beta angle are valid indicators for A - p assessment, no single measurement is perfect in all cases. A combination of different measurements should be used to have a true assessment of the sagittal jaw relationship.
In our study, the Mew line is 41.2 mm for males and 39.4 mm for women which is 2 mm less than the British population. Comparison between males and females, the Mew line is 1.76 mm greater in males than that in females. The zero meridian line is 0.2 mm for women and 0.8 mm for males which is similar to the Caucasian normal value. Female subjects had more prominent chins than male subjects in Central Gujarat Population.
The novelty of this study is that it gives a good estimate of the sagittal discrepancy of the maxilla and mandible as related to the soft tissue profile. These norms are easy as they can be asses clinically on the chair side, on the photograph, and on the radiograph. Radiation exposure can be reduced by eliminating radiographs. These norms are helping the clinician in the diagnosis of cases, where is retraction and protraction of jaws have considered, such as extraction, non-extraction, functional, surgical treatment, etc. The limitation of this study is that it can be applied only to the population of central Gujarat.
The normal value for soft tissue pogonion to the Zero meridian line is 0.8 + 1.8 mm for males and 0.2 + 1.7 mm for females, and the normal value for the Mew line is 41.2 + 3.2 mm for males and 39.4 + 2.2 mm for female in Central Gujarat population. Values other than normal suggests skeletal sagittal discrepancy of the maxilla and/or mandible, which is helpful in diagnosis. Separate norms should be set for different ethnic groups and patients should be treated keeping their ethnic background in mind. These norms are helping the clinician in the diagnosis of cases, where is retraction and protraction of jaws have considered, such as extraction, non-extraction, functional, surgical treatment, etc. The limitation of this study is that it can be applied only to the population of central Gujarat.
- Ishikawa H, Nakamura S, Iwasaki H, Kitazawa S. Seven parameters describing anteroposterior jaw relationships: Post pubertal prediction accuracy and interchangeability. Am J Orthod Dentofacial Orthop. 2000; 117:714‑720.
- Baik CY, Ververidou M. A new approach of assessing sagittal discrepancy: The Beta angle. Am J Orthod Dentofacial Orthop. 2004; 126: 100‑105.
- Broadbent BH. A new x‑ray technique and its application to orthodontia. Angle Orthod. 1931; 1:45‑66.
- Downs WB. Analysis of the dentofacial profile. Angle Orthod. 1956; 26:191‑212.
- Steiner CC. Cephalometrics for you and me. Am J Orthod.1953; 39:729‑755.
- Tweed CH. Evolutionary trends in orthodontics, past, present and future. Am J Orthod. 1953; 39:81‑108.
- Tweed CH. The Fränkfort‑mandibular incisor angle [FMIA] in orthodontic diagnosis, treatment planning and prognosis. Angle Orthod. 1954; 24:121‑69.
- Ricketts RM, Schulhof RJ, Bagha L. Orientation-sella-nasion or Frankfort horizontal. Am J Orthod. 1976 Jun;69(6):648-54. doi: 10.1016/0002-9416(76)90147-0. PMID: 1064336.
- Ricketts RM. Perspectives in the clinical application of cephalometrics. The first fifty years. Angle Orthod. 1981 Apr;51(2):115-50. doi: 10.1043/0003-3219(1981)051<0115:PITCAO>2.0.CO;2. PMID: 6942666.
- Jacobson A. The “Wits” appraisal of jaw disharmony. Am J Orthod. 1975; 105: 328‑344.
- Jacobson A. Application of the "Wits" appraisal. Am J Orthod. 1976 Aug;70(2):179-89. doi: 10.1016/s0002-9416(76)90318-3. PMID: 1066054.
- Coben SE. The integration of facial skeletal variants. Am J Orthod. 1955; 41: 407‑434.
- Wylie WL. The assessment of anteroposterior dysplasia. Angle Orthod. 1947; 7: 97‑109.
- Sassouni V. A classification of skeletal facial types. Am J Orthod. 1969 Feb;55(2):109-23. doi: 10.1016/0002-9416(69)90122-5. PMID: 5249177.
- Sassouni V. The Class II syndrome: differential diagnosis and treatment. Angle Orthod. 1970 Oct;40(4):334-41. doi: 10.1043/0003-3219(1970)040<0334:TCISDD>2.0.CO;2. PMID: 5272409.
- Enlow DH, Moyers RE, Hunter WS, McNamara JA Jr. A procedure for the analysis of intrinsic facial form and growth. An equivalent-balance concept. Am J Orthod. 1969 Jul;56(1):6-23. doi: 10.1016/0002-9416(69)90254-1. PMID: 5255278.
- Bimler HP. The Bimlercephalometric analysis. Germany: Wiesbaden; 1973.
- Beatty EJ. A modified technique for evaluating apical base relationships. Am J Orthod. 1975 Sep;68(3):303-15. doi: 10.1016/0002-9416(75)90238-9. PMID: 1057851.
- Di Paolo RJ, Philip C, Maganzini AL, Hirce JD. The quadrilateral analysis: an individualized skeletal assessment. Am J Orthod. 1983 Jan;83(1):19-32. doi: 10.1016/0002-9416(83)90267-1. PMID: 6571768.
- Williams S, Leighton BC, Nielsen JH. Linear evaluation of the development of sagittal jaw relationship. Am J Orthod. 1985 Sep;88(3):235-41. doi: 10.1016/s0002-9416(85)90218-0. PMID: 3862346.
- Yang SD, Suhr CH. F-H to AB plane angle (FABA) for assessment of anteroposterior jaw relationships. Angle Orthod. 1995;65(3):223-31; discussion 232. doi: 10.1043/0003-3219(1995)065<0223:FTAPAF>2.0.CO;2. PMID: 7639436.
- Nanda RS, Merrill RM. Cephalometric assessment of sagittal relationship between maxilla and mandible. Am J Orthod Dentofacial Orthop. 1994 Apr;105(4):328-44. doi: 10.1016/s0889-5406(94)70127-x. PMID: 8154458.
- González-Ulloa M, Stevens E. The role of chin correction in profileplasty. Plast Reconstr Surg. 1968 May;41(5):477-86. doi: 10.1097/00006534-196805000-00010. PMID: 5652638.
- Naini FB. Facial aesthetics: Concepts and clinical diagnosis. 1st ed. Oxford: Wiley-Blackwell. 2011; 71-85.
- Mew J. Use of the 'indicator line' to assess maxillary position. Funct Orthod. 1991 Jan-Feb;8(1):29-32. PMID: 1937156.
- Ricketts R M. The biological significance of the Devine Proportion and Fibonacci series. Am J Orthod. 1982; 81: 351-70.
- Moss JP, Linney AD, Lowey MN. The use of three-dimensional techniques in facial esthetics. Semin Orthod. 1995 Jun;1(2):94-104. doi: 10.1016/s1073-8746(95)80096-4. PMID: 8935048.
- Platou C, Zachrisson BU. Incisor position in Scandinavian children with ideal occlusion. A comparison with the Ricketts and Steiner standards. Am J Orthod. 1983 Apr;83(4):341-52. doi: 10.1016/0002-9416(83)90231-2. PMID: 6573148.
- Kerr WJ, Ford I. A comparison of facial form in three Western European male groups. Eur J Orthod. 1986 May;8(2):106-11. doi: 10.1093/ejo/8.2.106. PMID: 3459661.
- Kitafusa, Y: Changing Occlusal Patterns and the Indicator Line in Extraction and NonExtraction Treatment. Eur J Orthod. 2001; 24: 568.
- Vinay K., Shobha S. Cephalometric Assessment of Sagittal Dysplasia: A review of Twenty-one methods. J Ind Orthod Soc. 2014; 48: 33-41.
- Akhilesh B., Deepti D., Vinay D. Determining the sagittal relationship between the maxilla and mandible by Cannons analysis in Chhattisgarh population. National J of Medical and dental Research. 2017; 6: 33-318.
- Ahmed M, Shaikh A, Fida M. Diagnostic validity of different cephalometric analyses for assessment of the sagittal skeletal pattern. Dental Press J Orthod. 2018 Sep-Oct;23(5):75-81. doi: 10.1590/2177-6709.23.5.075-081.oar. PMID: 30427496; PMCID: PMC6266314.
- Adeel A B, Chauhan A K, Anil S, Santosh K. Cephalometric analysis for assessing sagittal jaw relationship- A comparative study. Ind J Orthod Dento Research. 2021; 7:150-159.